Purpose
This vignette demonstrates how to use {a11ytables} to generate a spreadsheet output that automatically follows best practice.
Installation
Install the package from GitHub using {remotes}.
install.packages("remotes")  # if not already installed
remotes::install_github("co-analysis/a11ytables")
The package depends on {openxlsx} and {pillar}, which are also installed with {a11ytables}.
Workflow
Having installed the {a11ytables} package, there are three steps to generating a compliant spreadsheet:
- Use
create_a11ytable()to create a special dataframe (with class ‘a11ytable’) that contains all the content that will go in your spreadsheet - Pass the output to
generate_workbook()to convert the a11ytable to {openxlsx}‘s ’Workbook’ class, which adds spreadsheet structure and styles - Pass the output to
openxlsx::saveWorkbook()to write out to an xlsx file (oropenxlsx::openXL()to open a temporary copy)
You can use the package’s RStudio Addin, which is installed with {a11ytables}, to insert a pre-filled demo skeleton of this workflow (RStudio users only).
1. Create an a11ytable
Each argument to create_a11ytable() provides the
information needed to construct each sheet in the spreadsheet.
| Argument | Required | Type | Accepted values | Explanation |
|---|---|---|---|---|
tab_titles |
Yes | Character vector | The name that will appear on each sheet’s tab in the output spreadsheet | |
sheet_types |
Yes | Character vector | ‘cover’, ‘contents’, ‘notes’, ‘tables’ | The kind of information that the sheet holds, which is needed so that the correct structure and formatting can be applied later |
sheet_titles |
Yes | Character vector | The main heading of each sheet, which will appear in cell A1 | |
blank_cells |
No | Character vector | A sentence that explains the reason for any blank cells in the sheet (if applicable) | |
custom_rows |
No | List of character vectors | Arbitrary rows of text that the user wants to insert above a table, one list-item per sheet (contents, notes and tables sheets), one vector element per row | |
sources |
No | Character vector | A sentence provides the source of the data found in
each table (if applicable, likely only needed for sheets with
sheet_types of ‘table’) |
|
tables |
Yes | List of dataframes (although the cover sheet content can be provided as a list object) | The main content for each sheet, expressed as flat (probably tidy) dataframes of rows and columns (though the cover can be a list) |
You can read more about these arguments and their requirements in the
function’s help pages, which you can access by running
?create_a11ytable in the R console. See also the terminology
vignette, vignette("terminology", "a11ytables"), for
these terms and more.
Pre-prepare tables
Rather than pass a big list of dataframes directly to the
tables argument of create_a11ytable(), it’s
preferable to prepare them first into their own named objects.
Below are some demo tables that we will later pass to
create_a11ytable(). I’ve used
tibble::tribble() for human-readable row-by-row dataframe
construction, but you can just use data.frame() if you
want.
Note that you can use the RStudio Addin ‘Insert table templates using ’tibble’’ and ‘Insert table templates using ’data.frame’’ to insert a demo skeleton into your R script.
Meta-sheets
The cover can accept either a list or a data.frane (the latter was the only acceptable input prior to version 0.2.0). We recommend a list so that you can have multiple rows per section on the cover. This also means you can dedicate certain rows to be hyperlinks to web URLs or mailto links that will open an email client. Here’s a demo list for the contents page (required):
cover_list <- list(
  "Section 1" = c("First row of Section 1.", "Second row of Section 1."),
  "Section 2" = "The only row of Section 2.",
  "Section 3" = c(
    "[Website](https://co-analysis.github.io/a11ytables/)",
    "[Email address](mailto:fake.address@a11ytables.com)"
  )
)
Note: a list is the preferred method of input for the cover. Previously, a data.frame was the only way to supply the data for the cover sheet in version 0.1 of the package.
Here’s a demo table for the contents page (required):
contents_df <- data.frame(
  "Sheet name" = c("Notes", "Table_1", "Table_2"),
  "Sheet title" = c(
    "Notes used in this workbook",
    "First Example Sheet",
    "Second Example Sheet"
  ),
  check.names = FALSE
)
And here’s a demo table for the notes page (not required if there’s no notes in your tables), which has a column for the note number in the form ‘[note x]’ and a column for the note itself:
notes_df <- data.frame(
  "Note number" = paste0("[note ", 1:3, "]"),
  "Note text" = c("First note.", "Second note.", "Third note."),
  check.names = FALSE
)
Click to preview these objects
cover_list
# $`Section 1`
# [1] "First row of Section 1."  "Second row of Section 1."
#
# $`Section 2`
# [1] "The only row of Section 2."
#
# $`Section 3`
# [1] "[Website](https://co-analysis.github.io/a11ytables/)"
# [2] "[Email address](mailto:fake.address@a11ytables.com)"
contents_df
#   Sheet name                 Sheet title
# 1      Notes Notes used in this workbook
# 2    Table_1         First Example Sheet
# 3    Table_2        Second Example Sheet
notes_df
#   Note number    Note text
# 1    [note 1]  First note.
# 2    [note 2] Second note.
# 3    [note 3]  Third note.
Statistical tables
The code below generates a demo data.frame that we’re going to pretend is the statistical data that we want to publish. It has columns with different sorts of data that we might want to publish. It also has suppressed values (e.g. ‘[c]’ meaning ‘confidential’ data) and includes notes (in the form ‘[note x]’).
table_1_df <- data.frame(
  Category = LETTERS[1:10],
  "Numeric [note 1]" = 1:10,
  "Numeric suppressed" = c(1:4, "[c]", 6:9, "[x]"),
  "Numeric thousands" = abs(round(rnorm(10), 4) * 1e5),
  "Numeric decimal" = abs(round(rnorm(10), 5)),
  "This column has a very long name that means that the column width needs to be widened" = 1:10,
  Notes = c("[note 1]", rep(NA_character_, 4), "[note 2]", rep(NA_character_, 4)),
  check.names = FALSE
)
We’ll create a second, simpler table as well, which will go on a separate sheet:
table_2_df <- data.frame(Category = LETTERS[1:10], Numeric = 1:10)Click to preview these tables of statistical data
table_1_df
#    Category Numeric [note 1] Numeric suppressed Numeric thousands
# 1         A                1                  1            140000
# 2         B                2                  2             25530
# 3         C                3                  3            243730
# 4         D                4                  4               560
# 5         E                5                [c]             62160
# 6         F                6                  6            114840
# 7         G                7                  7            182180
# 8         H                8                  8             24730
# 9         I                9                  9             24420
# 10        J               10                [x]             28270
#    Numeric decimal
# 1          0.55370
# 2          0.62898
# 3          2.06502
# 4          1.63099
# 5          0.51243
# 6          1.86301
# 7          0.52201
# 8          0.05260
# 9          0.54300
# 10         0.91407
#    This column has a very long name that means that the column width needs to be widened
# 1                                                                                      1
# 2                                                                                      2
# 3                                                                                      3
# 4                                                                                      4
# 5                                                                                      5
# 6                                                                                      6
# 7                                                                                      7
# 8                                                                                      8
# 9                                                                                      9
# 10                                                                                    10
#       Notes
# 1  [note 1]
# 2      <NA>
# 3      <NA>
# 4      <NA>
# 5      <NA>
# 6  [note 2]
# 7      <NA>
# 8      <NA>
# 9      <NA>
# 10     <NA>
table_2_df
#    Category Numeric
# 1         A       1
# 2         B       2
# 3         C       3
# 4         D       4
# 5         E       5
# 6         F       6
# 7         G       7
# 8         H       8
# 9         I       9
# 10        J      10
See the best practice guidance for more information on how to present data in these tables.
Create a11ytable
Now we can construct an a11ytable by passing the required sheet
elements as character vectors with c()—or a
list() in the case of the tables and
custom_rows arguments—to the
create_a11ytable() function.
Note that:
- the element index of the object supplied to each argument is the
sheet that it will be applied to (e.g. the tab title of the first sheet
will be ‘Cover’, the sheet type of the second sheet will be ‘contents’
and the fourth sheet will contain the
table_1_dftable) - you must use
NA_character_wherever an element isn’t required (e.g. there is no information about blank cells nor sources for the first three sheets) - you can insert a template of this demo using the package’s RStudio Addin
my_a11ytable <-
  a11ytables::create_a11ytable(
    tab_titles = c("Cover", "Contents", "Notes", "Table 1", "Table_2"),
    sheet_types = c("cover", "contents", "notes", "tables", "tables"),
    sheet_titles = c(
      "The 'a11ytables' Demo Workbook",
      "Table of contents",
      "Notes",
      "Table 1: First Example Sheet",
      "Table 2: Second Example Sheet"
    ),
    blank_cells = c(
      rep(NA_character_, 3),
      "Blank cells indicate that there's no note in that row.",
      NA_character_
    ),
    custom_rows = list(
      NA_character_,
      NA_character_,
      "A custom row.",
      c(
        "First custom row [with a hyperlink.](https://co-analysis.github.io/a11ytables/)",
        "Second custom row."
      ),
      "A custom row."
    ),
    sources = c(
      rep(NA_character_, 3),
      "[The Source Material., 2024](https://co-analysis.github.io/a11ytables/)",
      "The Source Material, 2024."
    ),
    tables = list(cover_list, contents_df, notes_df, table_1_df, table_2_df)
  )
# Warning: These tab_titles have been cleaned automatically: Table 1 (now
# Table_1).
# Warning: Some notes are in the notes sheet (3) but are missing from the tables.
The function will return errors or warnings if anything is missing or
seems odd. For example, we were warned that a value we supplied to
tab_title had to be cleaned from ‘Table 1’ to ‘Table_1’,
since blank spaces are not allowed in tab names. Note that there will be
an error if there are any tab titles that start with a numeral.
Here’s a preview of the object that was created:
my_a11ytable
# # a11ytable: 5 x 7
#   tab_title sheet_type sheet_title   blank_cells source custom_rows table
#   <chr>     <chr>      <chr>         <chr>       <chr>  <list>      <list>
# 1 Cover     cover      The 'a11ytab… NA          NA     <chr [1]>   <named list>
# 2 Contents  contents   Table of con… NA          NA     <chr [1]>   <df [3 × 2]>
# 3 Notes     notes      Notes         NA          NA     <chr [1]>   <df [3 × 2]>
# 4 Table_1   tables     Table 1: Fir… Blank cell… [The … <chr [2]>   <df>
# 5 Table_2   tables     Table 2: Sec… NA          The S… <chr [1]>   <df>
You can immediately tell that this is an a11ytable because it’s the first word that’s printed with the output.
So our a11ytable is basically just a table with one row per sheet and
one column per sheet element. In fact, it has class ‘data.frame’/‘tbl’
along with ‘a11ytable’. For convenience, you can also check for the
a11ytable class with is_a11ytable().
Note that create_a11ytable() is the preferred method for
generating a11ytable-class objects, but it’s also possible to convert a
correctly-formatted, pre-built data.frame or tibble directly to an
a11ytable with as_a11ytable().
2. Convert to a workbook
We can use generate_workbook() to convert our a11ytable
to an {openxlsx}
Workbook-class object.
This type of object adds information from each row of our a11ytable into separate sheets and applies other relevant structure, mark-up and styles for compliance with the best practice guidance.
my_wb <- a11ytables::generate_workbook(my_a11ytable)Click for a preview of the Workbook object
The print method for a Workbook-class object is fairly limited, but you can see an overview of our named sheets and some of the custom styling.
my_wb
# A Workbook object.
#
# Worksheets:
#  Sheet 1: "Cover"
#
#   Custom row heights (row: height)
#    2: 34, 5: 34, 7: 34
#   Custom column widths (column: width)
#     1: 72
#
#
#  Sheet 2: "Contents"
#
#   Custom column widths (column: width)
#     1: 16, 2: 56
#
#
#  Sheet 3: "Notes"
#
#   Custom column widths (column: width)
#     1: 16, 2: 56
#
#
#  Sheet 4: "Table_1"
#
#   Custom column widths (column: width)
#     1: 16, 2: 16, 3: 16, 4: 16, 5: 16, 6: 32, 7: 16
#
#
#  Sheet 5: "Table_2"
#
#   Custom column widths (column: width)
#     1: 16, 2: 16
#
#
#
#  Worksheet write order: 1, 2, 3, 4, 5
#  Active Sheet 1: "Cover"
#   Position: 1
3. Write to file
Finally, you can use the
saveWorkbook() function from {openxlsx} to write your
workbook object to an xlsx file (set the filename argument to a location
suitable for your work).
openxlsx::saveWorkbook(my_wb, "publication.xlsx")You could also open a temporary copy of the workbook with
openxlsx::openXL(), which is convenient during the
development process.
Output
The content of your output spreadsheet will end up looking something like this:
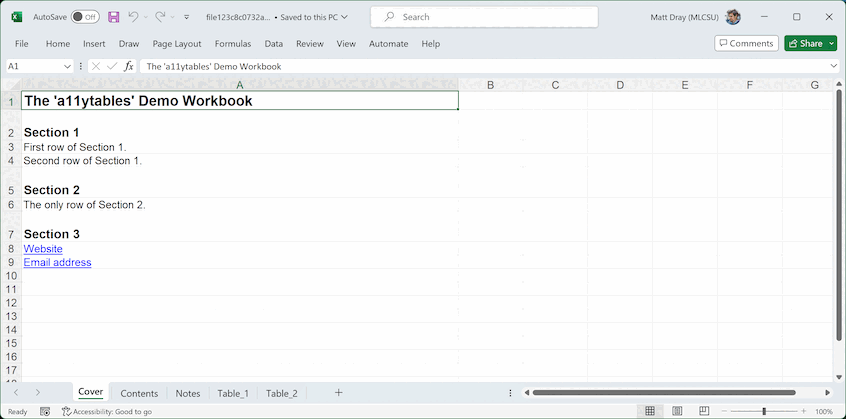
You’ll notice that various best-practice formatting (e.g. Arial size 12 font for body text) and mark-up (e.g. tables, donated by a marker in the lower-right corner of the lower-right cell of each one) have been applied throughout.
Note also that two ‘pre-table’ meta-elements were created
automatically in the sheets that contain statistical tables, which you
didn’t need to supply to create_a11ytable(): (1) the number
of tables and (2) the presence of notes. These are required for
accessibility good practice.
Final tweaks
It’s your responsibility to check and amend the output from {a11ytables} to ensure it meets users’ accessibility needs.
You can apply some final tweaks to the output xlsx file if the defaults don’t quite meet your requirements (e.g. some column widths), though it’s advisable to keep changes to a minimum for reproducibility purposes and because you may undo some of the compliant structuring and formatting that {a11ytables} provides.
At time of writing (v0.3.0) you might want to address manually some other accessibility requirements that are not yet covered by the package:
- Fill in the document properties, which you are likely to find under ‘File’ then ‘Properties’ in your spreadsheet software
- Convert to an ODS file rather than the proprietary xlsx format
- Various number-formatting issues, like padding decimal places with zeroes
We’re trying to address a number of these limitations. Please see the issues on GitHub for the current status.
Contribute
To contribute, please add an issue or a pull request after reading the code of conduct and contributing guidance.